Inside Our +7,735.24 USDC 7-Day Polymarket Execution System
Breakdown of a +7,735.24 USDC 7-day Polymarket run: the exact workflow, risk controls, metric definitions, and a checklist to replicate the process.
How AI Agents Can Automate Polymarket Trading for +7,735.24 USDC in 7 Days
If you're building AI agents for crypto trading or researching automated Polymarket execution, this post breaks down our +7,735.24 USDC PnL result from a 7-day run. You'll learn the repeatable process, risk controls, and operational lessons that turned edge into profits—without hype or hero trades.
Most Polymarket performance posts show a headline number and stop there. We wanted this one to be useful.
Over a 7-day window, we generated +7,735.24 USDC PnL with a 60% win rate (18W / 12L) and +24.18% average PnL. Instead of framing that as a one-off success story, this post explains the execution system behind it, what failed, and what a team can realistically replicate.
If you are researching Polymarket trading with OpenClawCash, the key takeaway is simple: edge quality matters, but operational quality decides whether edge turns into realized outcomes.
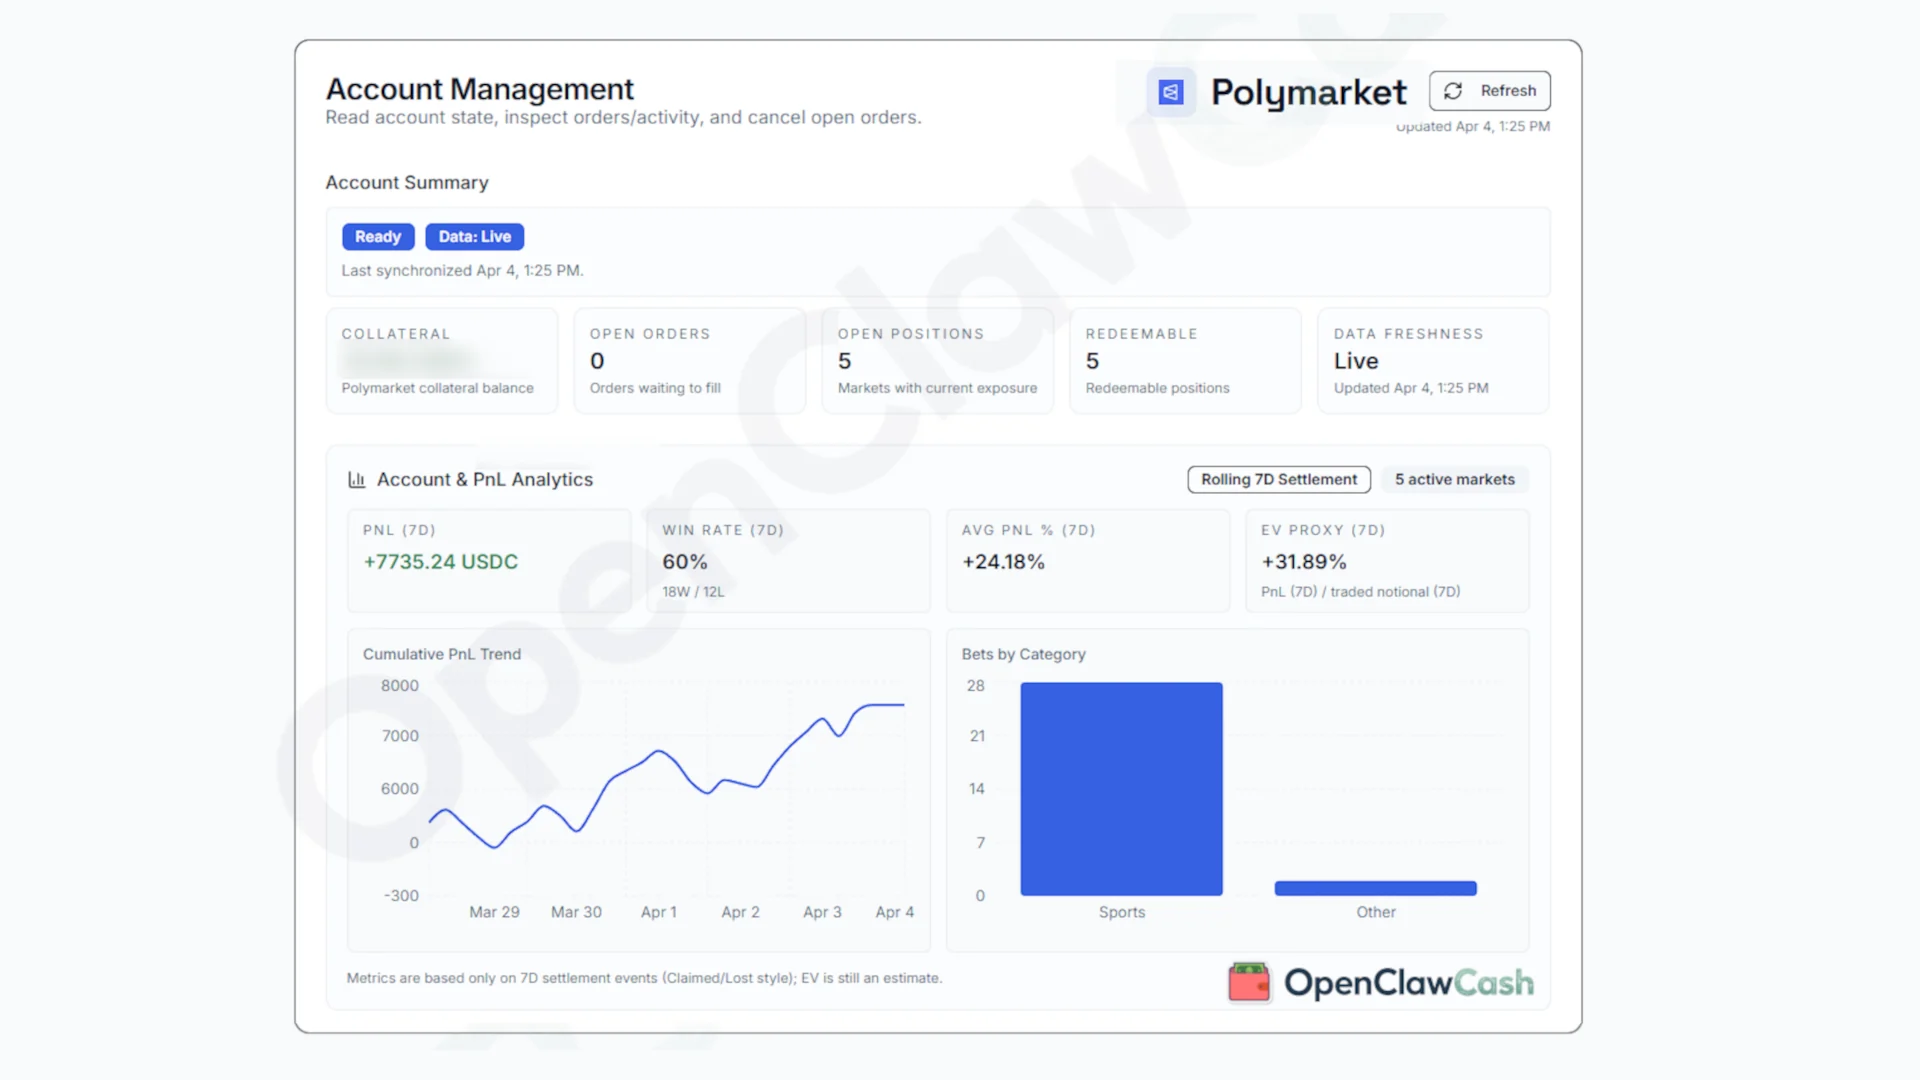
7-Day Snapshot
- PnL (7D): +7,735.24 USDC
- Win Rate (7D): 60% (18W / 12L)
- Avg PnL % (7D): +24.18%
- EV Proxy (7D): +31.89%
- Active markets: 5
- Collateral balance: 35.66 USDC
- Open orders: 0
- Redeemable positions: 5
- Data freshness: Live
These metrics describe a full operating week across multiple positions, not a single outlier trade.
What Actually Drove the Result
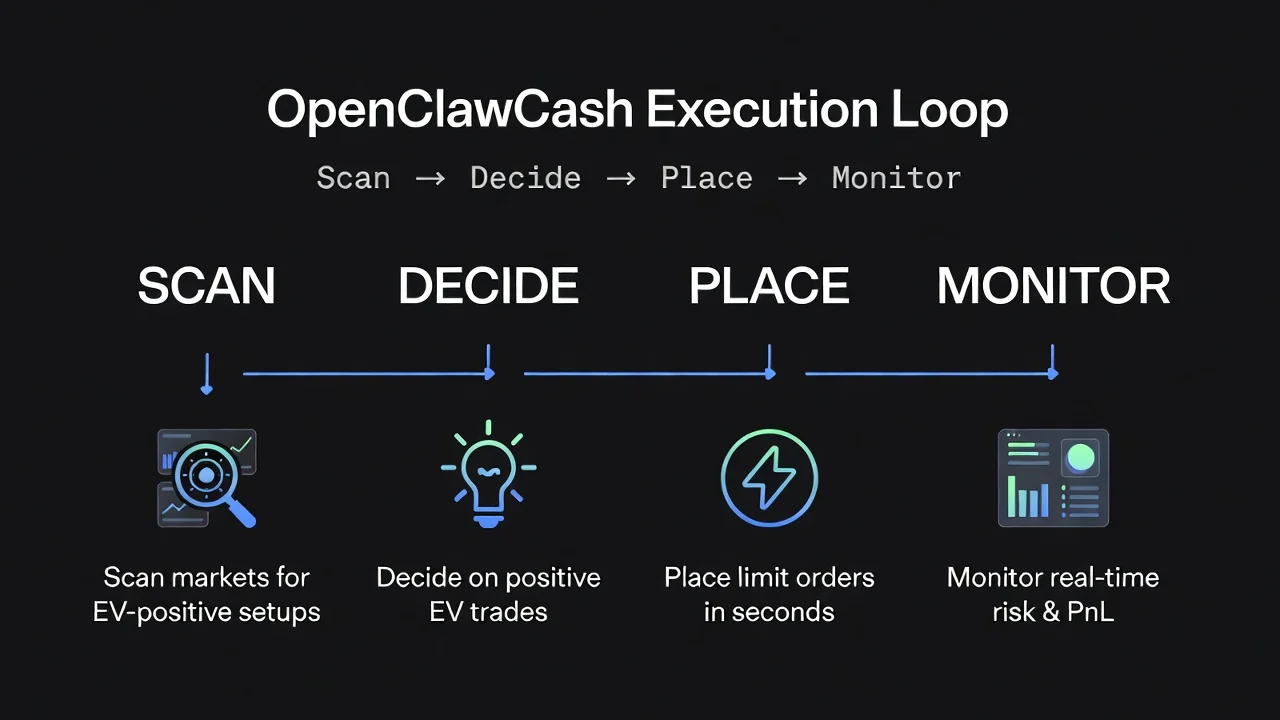
The process was built around one repeatable loop:
scan -> rank setups -> define risk -> place -> monitor -> close/redeem -> review
That loop created three practical advantages:
- Faster time from conviction to execution
- Risk checks before orders, not after losses
- Daily feedback that improved next-day setup selection
The strongest gains came from reducing execution mistakes, not from taking extreme directional bets.
A Real Trade Pattern We Repeated
We did not run a hero-trade model. We used the same decision structure repeatedly.
-
Thesis Market-implied probability differed enough from our internal estimate to justify risk.
-
Entry condition We only entered when expected value stayed positive after fee and slippage assumptions.
-
Position sizing Size was capped by account-level exposure limits before an order was sent.
-
Invalidation rule If the edge compressed below threshold, we reduced size or exited.
-
Post-trade classification Each settled outcome was tagged so setup quality could be re-ranked daily.
This structure is less exciting than narrative-driven calls, but it is far more stable in live conditions.
Risk Rules That Protected the Week
A profitable week can still hide fragile behavior. These hard constraints prevented that:
- Maximum size per market
- Daily account loss cap
- Maximum concurrent market exposure
- No averaging down outside predefined rules
- Stop-trading trigger after consecutive low-quality signals
Without enforced constraints, even good models drift into avoidable losses.
How We Define the Metrics
To keep performance interpretation consistent, each metric is tied to settled outcomes.
- PnL (7D): Net realized profit/loss over the 7-day period
- Win Rate (7D): Settled wins divided by total settled outcomes
- Avg PnL % (7D): Mean return percentage across settled positions
- EV Proxy (7D): Internal expected-value ranking signal used pre-trade
The EV proxy helps prioritize opportunities, but it is not a guarantee. Every setup still passes risk gating before execution.
What Went Wrong and What We Changed
Two issues showed up during the run:
- Late entries after edge compression
- Overweighting narrative conviction versus cleaner risk/reward setups
Adjustments made during the same week:
- Tighter entry timing windows
- Lower ranking weight for narrative-heavy setups
- Higher penalties for low-liquidity conditions
These corrections improved decision quality faster than adding new strategy complexity.
Why This Matters for Operators
Many teams focus on prediction quality and underinvest in execution reliability. In practice, the reverse order is often more important:
- First, make execution consistent
- Then, harden risk controls
- Then, optimize signal quality
That ordering is what allowed this 7-day result to compound instead of fragment.
Get Started Quickly
If you want to deploy the same operating pattern:
- Sign up for OpenClawCash.
- Complete the Polymarket setup wizard.
- Generate an API key and connect your execution flow.
The venue flow takes about a minute end to end: connect, fund the wallet, and trade. Gasless transactions on Polygon by default.
Useful links:
Practical Replication Checklist
Before going live, confirm all five are true:
- Setup ranking and edge thresholds are defined
- Trade/day/account risk limits are enforced
- Pre-trade checklist runs before every order
- Settled outcomes are logged with setup tags
- Daily review removes low-quality patterns quickly
Closing Takeaway
The +7,735.24 USDC week was the byproduct of disciplined execution, not a lucky spike. The most transferable lesson is that process quality is part of strategy performance.
If you want, the next breakdown can focus on the exact daily review format and risk-policy template used in this run.
Risk Disclosure
This is a transparent 7-day performance report, not financial advice.
- Prediction markets are volatile
- Losses are part of live trading
- Past performance does not guarantee future returns
- Position sizing and risk controls are mandatory